Finding The Right Sample Size (The Hard Way)
March 2022
This article is rated as:
In our previous article, ‘Finding the Right Sample Size (the Easy Way)’, we discuss the importance of determining the so-called “correct sample size”. Our recommendation for most applications was to use an online sample size calculator (check out our calculator HERE).
However, for those interested in calculating sample sizes by hand, or getting a better understanding of the math behind many of these sample size calculators, we outline the formulae used to calculate sample sizes.
Estimating sample sizes (The Hard Way)
Sample sizes can be estimated using statistical formulae by hand. While not recommended, it is important to have a basic understanding of how sample sizes are being estimated when using a tool.
First, some definitions.
Margin of error: The margin of error is how much you can expect your results to differ from the population of interest. Measured as a percentage, a smaller margin of error increases the chance that your results will be close to that of the population. Both 5% and 10% are commonly used margins of error. However, lower margin of errors will increase your sample sizes.
Confidence level: The confidence level is a percentage the represents how confident you can be that the true percentage of a population (i.e., a measured value, such as participant responses to a survey question) falls within the margin of error. This value is usually 95%, but 90% and 99% are also common. Larger confidence levels will increase your sample sizes.
z-score: A z-score is a value that determines how far a measured value is from the population value. z-scores can be determined from the confidence level using z-score tables (see Z Score Table for more information).
Population proportion: The population proportion is the percentage of the population that has a specific characteristic. This proportion is usually determined from previous studies or research. Although, when unsure, using 50% works as an estimate. That is, 50% of the population falls below a specific point and 50% falls above a specific point.
Calculating an estimated sample size
The following outlines the specifics of Cochran’s sample size formula. Using the unlimited formula based on your own estimates of the z-score (based on your confidence level), population proportion, and margin of error, you can get an estimate of a sample size required for a population of unlimited size. However, this is not realistic as populations are finite. Therefore, you can take the sample size estimate from the unlimited population formula and insert it into the finite population formula. This considers the size of the population of interest and provides a better estimate of the sample size based on your needs.
Unlimited population:
where:
n is the sample size
z is the z-score
p̂ is the population proportion
ε is the margin of error (confidence interval)
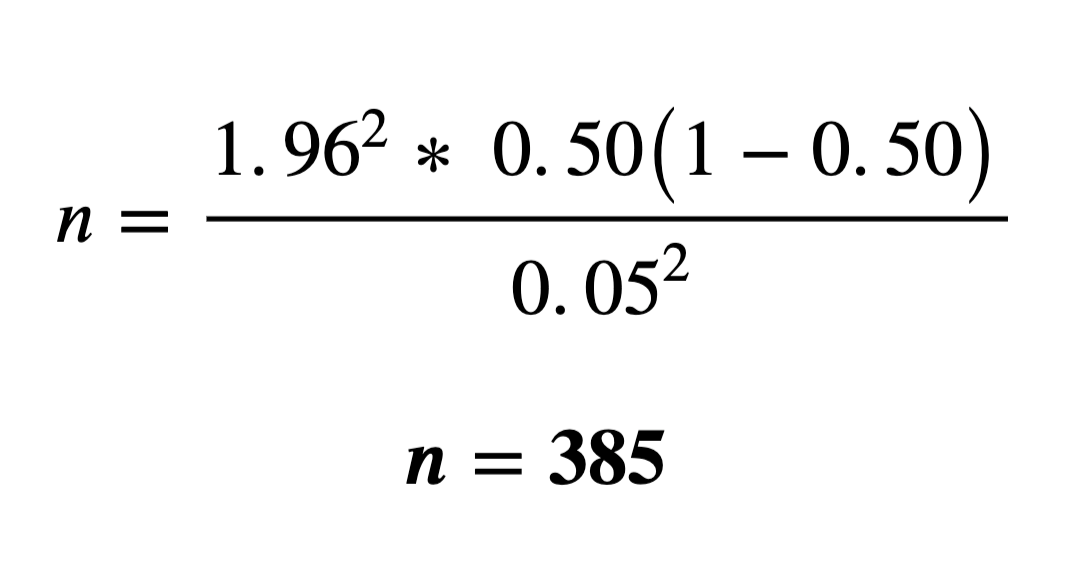
Example for unlimited population:
where:
z = 1.96 (Based on a 5% margin of error. Data are assumed two-tailed (i.e., a margin of error of 2.5% on each end of a normal distribution curve), thus a value of 0.9750 will be looked up within the z-score table.)
p̂ = 50% or 0.50 (This value is often pulled from previous research/ literature. If unsure, use 50%.)
ε = 5% or 0.05 (Same value used to get the z-score estimate but provided as a decimal/ percentage.)
Finite population:
where:
n is the sample size
z is the z-score
p̂ is the population proportion
ε is the margin of error
N is the population size
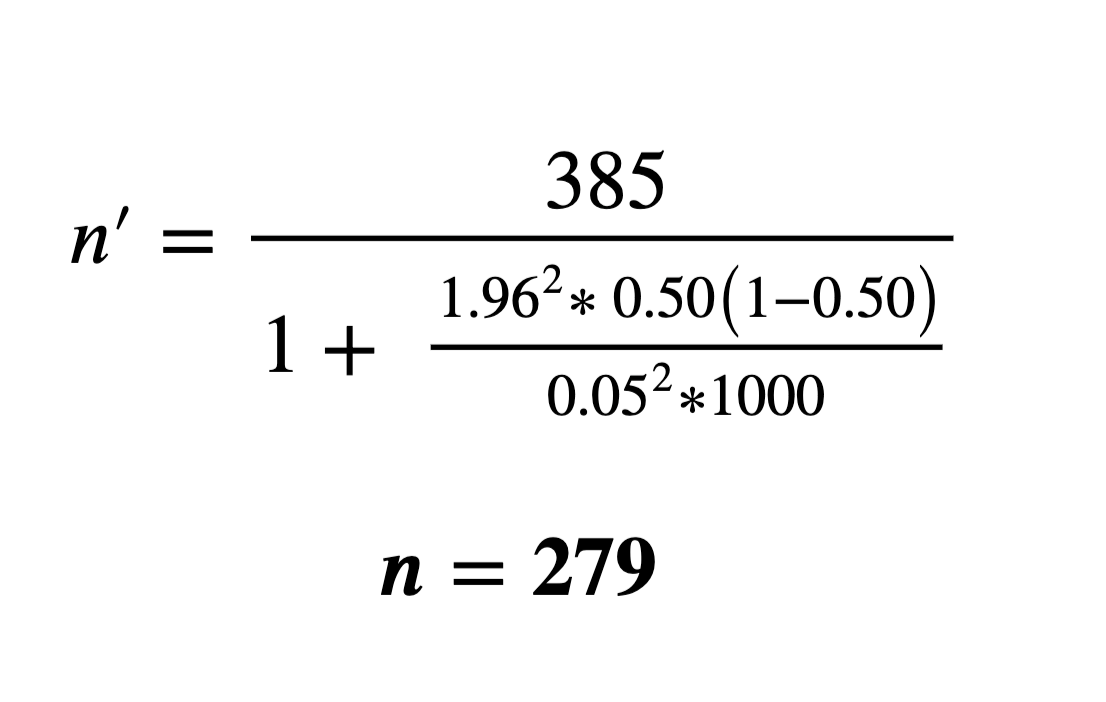
Example for a finite population:
where:
n = 385 (Value calculated using the infinite population formula.)
z = 1.96 (Based on a 5% margin of error. Data are assumed two-tailed (i.e., a margin of error of 2.5% on each end of a normal distribution curve), thus a value of 0.9750 will be looked up within the z-score table.)
p̂ = 50% or 0.50 (This value is often pulled from previous research/ literature. If unsure, use 50%.)
ε = 5% or 0.05 (Same value used to get the z-score estimate but provided as a decimal/ percentage.)
N = 1000 (This value is inserted if known and is often pulled from research/ literature or some prior background knowledge about the population of interest.)


